Decoding Big Tech Earnings Season: Reading Revenue, Segments, and Guidance Like an Analyst
A framework for reading Big Tech earnings in an analyst's sequence: segment mix, margins, capex, and guidance first—headline revenue only for cross-checking.
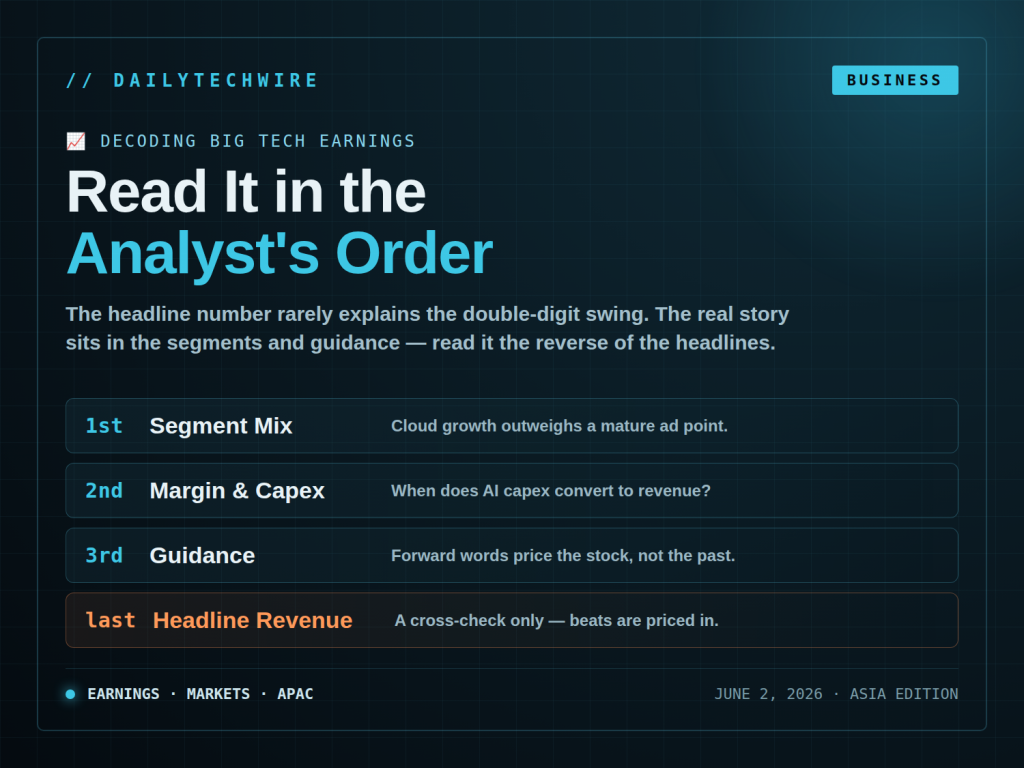
Every earnings season, the largest technology platforms release their quarterly reports within days of one another, and the after-hours stock reaction often swings by double digits. The problem is that the headline numbers (revenue and EPS) rarely explain those swings. Most of the story lies in the segment breakdown and forward guidance—two sections that quick news flashes typically skip.
Below is a framework for reading a Big Tech earnings report in the priority order an analyst uses, not the order the company wants you to read it.
Headline revenue: a starting point, not a conclusion
The first number the market looks at is total revenue and the magnitude of the beat or miss against consensus. But a 1–2% beat relative to expectations has already been priced in by the buy-side’s “whisper number,” so a nominal beat can still come with a falling stock.
What needs to be separated out immediately: is YoY growth organic or driven by M&A, and how much did currency affect it? Companies with large international revenue typically report “constant currency” growth as well. If nominal growth is meaningfully higher than constant-currency growth, part of the momentum comes from currency fluctuations rather than underlying demand.
Segment breakdown: where the story actually lies
Big Tech is a collection of businesses with very different profit margins. A platform may report total revenue in line with expectations while the underlying structure has already shifted.
For companies with a cloud arm, the cloud segment is often the part the market values most highly, because it determines future operating margin. Cloud carries higher gross margins than hardware or saturated advertising, so one percentage point of cloud growth carries more valuation weight than one point of growth in a mature segment.
For advertising, the two metrics to read are growth in the number of ad impressions versus the price per ad (pricing). Growth coming from pricing is more durable than growth from stuffing in more impressions, which is limited by user experience.
A classic red flag in the filing: a segment’s revenue rises but that segment’s operating income falls. This signals that the company is buying growth with spending, and margin compression is usually punished by the market more harshly than a revenue miss.
Operating margin and the capex cycle
In the current phase, capex on AI infrastructure is the variable governing many platforms’ margins. A sharp rise in capex doesn’t immediately show up on the income statement, but it brings depreciation expense in subsequent quarters and reduces free cash flow right away.
The question analysts pose on the earnings call is not “how much are you spending on AI” but “when will this capex convert into revenue.” The gap between the capex curve and the corresponding revenue curve is the main risk in valuing heavily investing platforms.
Guidance: the part that prices the stock, not the past
A stock price reflects future expectations, so forward guidance often carries more weight than the quarter just reported. A strong quarter paired with cautious guidance for the next quarter can send the stock down, and vice versa.
It’s necessary to distinguish guidance on revenue, on margin, and on capex. Some companies guide only revenue and leave margin blank—a signal worth noting when costs are in flux. The language in guidance also matters: shifting from “expect” to “anticipate,” or adding macro conditions, is a soft way of managing expectations downward.
Market reaction and information lag
The immediate after-hours price move reflects how algorithms and traders react to the headline numbers. The more structured reaction usually comes after the earnings call, when management answers questions on guidance and segments. For this reason, the next day’s closing price is often a more reliable signal than the after-hours swing.
Any statement about price direction needs to be tied to specific attribution from an analyst or filing, not speculation. An earnings report by itself is not a buy or sell recommendation.
Asia angle
For investors and developers in Asia-Pacific, two items worth tracking are revenue allocation by region and commentary on demand in Asian markets. Cloud and advertising growth in this region is often broken out in the geographic section of the report, and serves as an early indicator of capital flows as well as the level of data center infrastructure investment platforms plan to deploy in the region.
When reading a report, the logical sequence is: segment mix first, margin and capex next, guidance last, and headline revenue only for cross-checking. That is the reverse of how most headlines are written.